drug pricing

Finding the Right Price for a Drug across Multiple Indications; Learnings from Keytruda

Previously, Equinox has described a hypothetical exercise in which a development team attempts to find an optimal price for an agent that is in development in multiple indications.

Here we repeat this exercise with a real-world example, Keytruda.

Keytruda has been approved for a variety of indications.

has described

These indications differ in the size of the addressable patient population (bubble size), the level of unmet need (y axis) and, most importantly, the degree to which Keytruda delivers benefit to patients (x axis).

Finding the right price-per-vial across diverse indications is challenging. Equinox’s analytical tools allow product teams to quantify the value delivered in each population. When we plot the incremental clinical benefit delivered against incremental cost for successful agents, we see the following “cloud” relationship:

CvB without Keytruda and arrows.jpg

Each point represents a new agent in a specific patient population.

Equinox predicts that emerging agents that map within this cloud will receive favorable reimbursement, but agents that land below the cloud risk significant push-back from payers in those indications. Points above the cloud represent indications where the agent is under-priced.

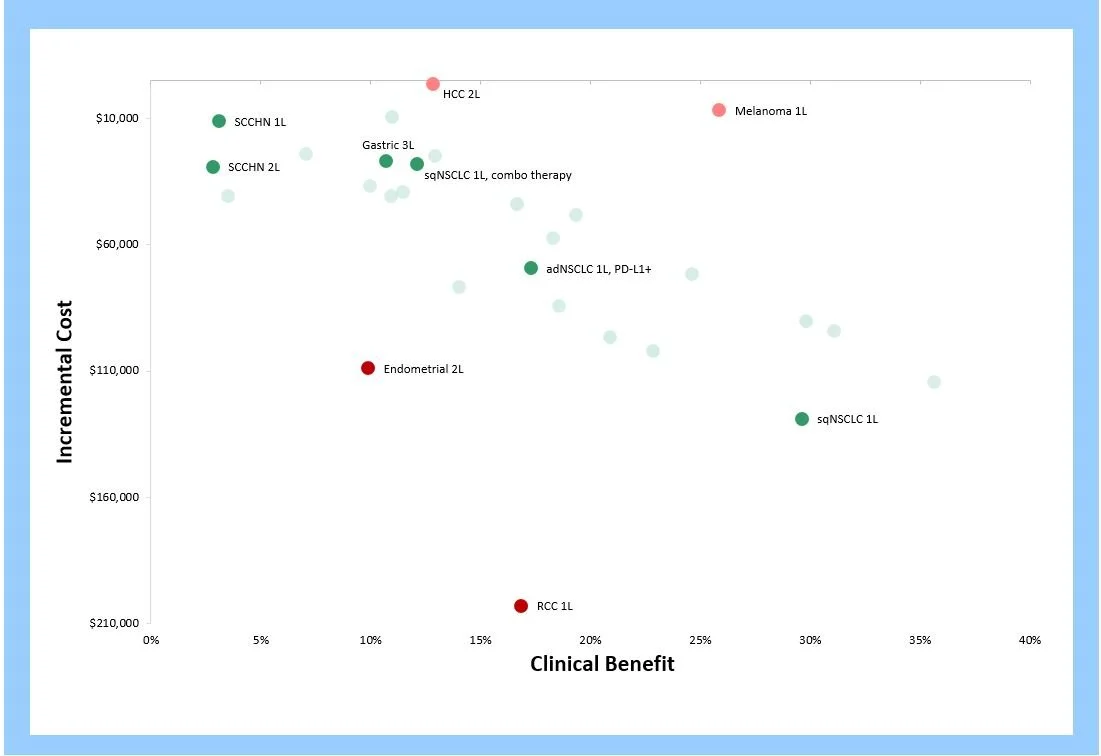
Compared to these exemplars, Keytruda’s various indications map as follows:

CvB with Keytruda.JPG

Keytruda’s price appears appropriate for Gastric, Head and Neck, and Lung Cancer. As a consequence, it offers poor value for money in RCC and Endometrial, and leaves money on the table in HCC and Melanoma. Overall, the price point appears optimized.

Equinox’s analytical tools allow product teams to assess the trade-offs inherent in arriving at a price for any agent in development for multiple indications.

Pricing a new oncology agent across multiple indications

If the patients are sick enough, the theory goes, you can charge a lot for your drug.  How much of a difference your drug makes also matters.

Consider an immuno-oncology agent to be added to the current standard of care in each of the four indications listed in Table 1.  The assumed clinical attributes for the new combination regimens are shown.  They include changes in median overall survival (adding 8 months), median time to progression (adding 4 months), response rates, safety/tolerability and dosing.

Capture.JPG

Applying our analytics, we can quantify the disease burden (mortality and morbidity) and the degree of improvement offered in each patient population. This allows an informed comparison with recent successful launches, and we can thus calculate the US WAC “normative price” for the added agent in each target population (second row in Table 2), based on the value delivered.

Capture 2.JPG

The normative prices for the new drug are translated into implied prices per cycle (third row), which in this example range from $2,500 to $11,700. 

These results allow the team to assess the opportunities and inform the clinical and commercial development strategy.  For instance, with a normative price of $63,100 and a large patient population, 2nd line CRC has high revenue potential (this tool also estimates peak-year patient share and revenue).  If this agent’s price were set at its CRC normative per-cycle price ($3,100), then it would also be seen as appropriately priced in 2nd line ovarian, but it would be somewhat expensive in 1st line melanoma, likely leading to downward pricing pressure and a greater likelihood of access limitations there.  It would however be underpriced in 2nd line head and neck cancer (normative = $11,700), leaving money on the table in that smaller population. 

We have used this framework to help clients evaluate pricing potential for new oncology and hematology drugs across as many as 25 candidate indications for a given asset.  Naturally, other factors affect how indications are prioritized: probability of technical success, strategic fit, and the length and cost of late-stage clinical trials.  Having a sound analysis of pricing potential can make for better development decisions, including not only which indications but also which combinations to pursue.    

Contact Equinox Group to see more details about this application of our tools.